Columns
The columns displayed on the Pages screen in ContentKing represent different properties of URLs on the website level.
You can also view these properties on the page level on the page detail screen which you can access by clicking on a URL on the Pages screen.
Each column on the Pages screen has a filter which you can use to filter out the data you are looking for. You can use as many columns as you want for filtering and combine them in any way.
You can always see which filters are active when hovering over the blue bar at the top of the screen:
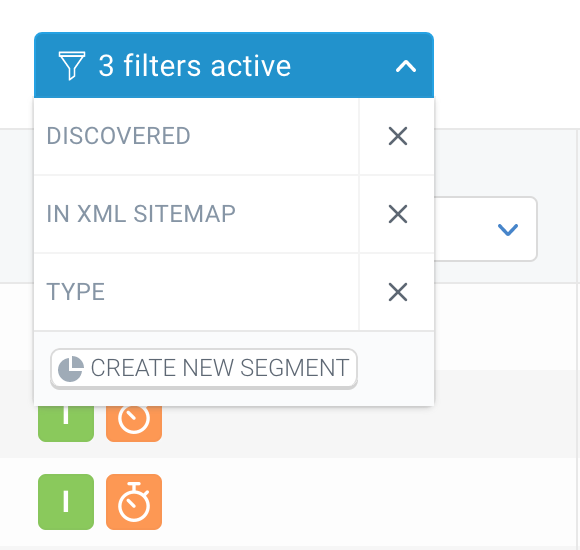
Once you have the right selection of data you are looking for, you can also save those filter criteria for later use by creating a segment. The segment will then always show you real-time data matching the filter criteria and you can also further work with the segment across the whole platform.
Managing columns on the Pages screen
When you add a website to ContentKing, there is a default set of displayed columns.
However, you can also add additional columns to the screen in the Manage Columns section to customize the Pages screen to your specific needs and display the metrics that are relevant or important for you.
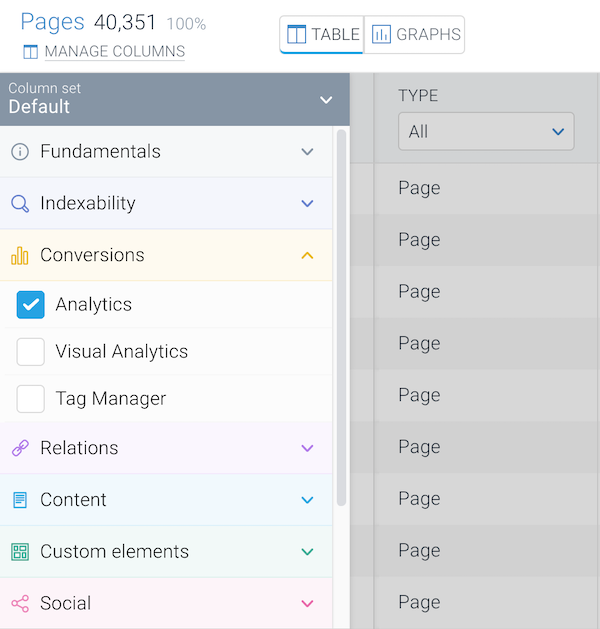
The columns in the Manage Columns section are grouped into categories.
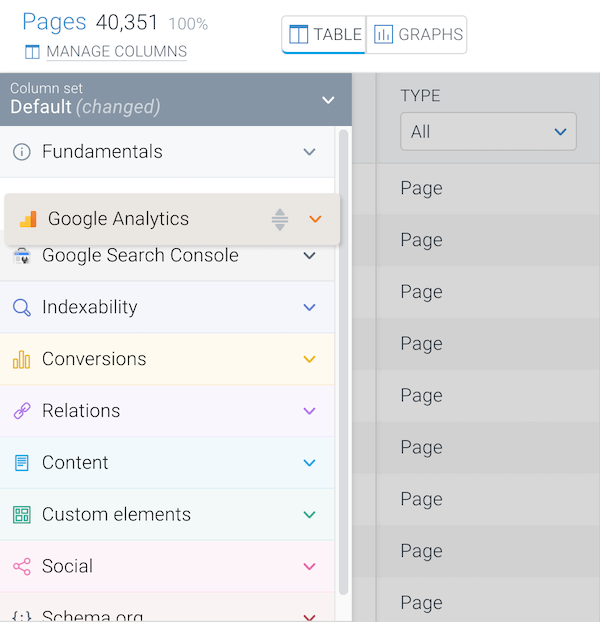
You can also change the order of the columns on the Pages screen by dragging the column categories in the Manage Columns section upwards or downwards.
Creating column sets
When managing columns in the Manage Columns section, you can also save a specific column configuration as a column set, which allows you to quickly switch between different views of the Pages screen.
To create a column set, select the columns that you want to be part of the set and click Save as in the bottom-left corner.
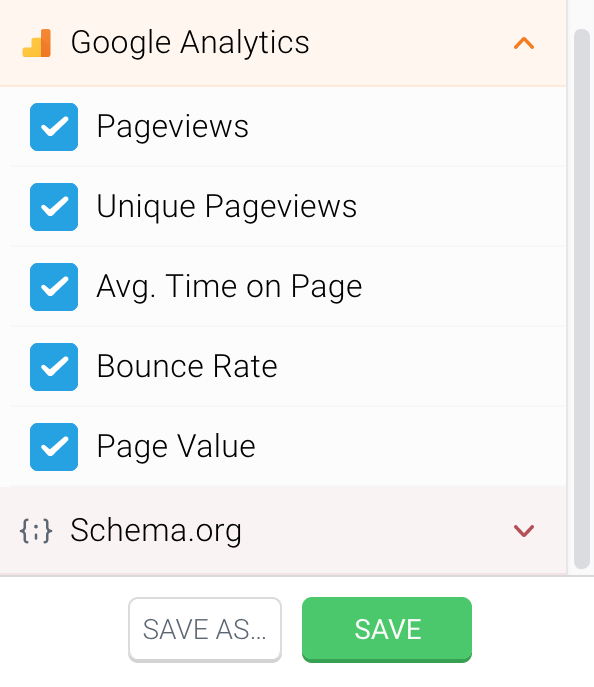
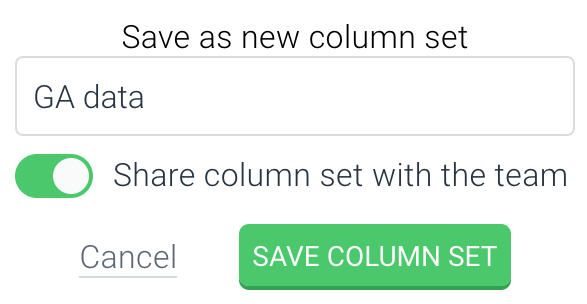
After clicking the button, enter the name of the column set and choose whether you want to share the set with the rest of your team or if it will only be available for you. Then click Save column set.
Columns and properties explained
This section lists all properties that are represented by a column in ContentKing and explains these properties.
Fundamentals
URL
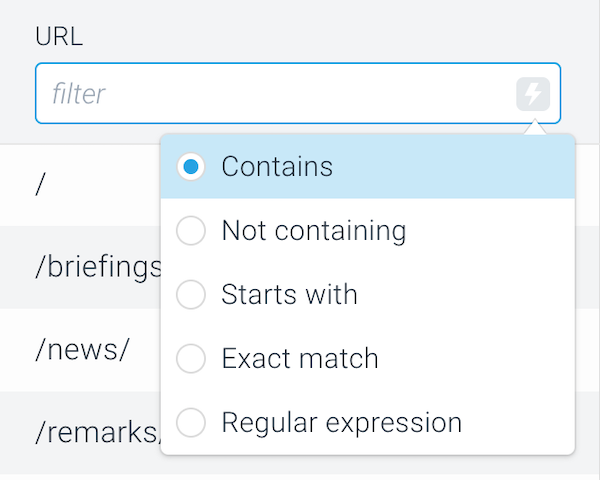
The URL column shows the relative URL path of all the URLs on the website. The filter in this column has the form of a text input field and you can also use advanced filter operators.
Type
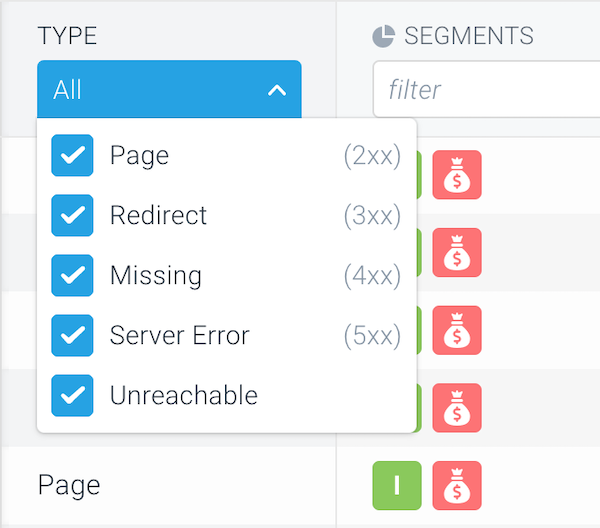
The Type column represents the types of URLs. The column has the following filter values (Types):
-
Page(URL returning the2xxstatus code) -
Redirect(URL returning the3xxstatus code) -
Missing(URL returning the4xxstatus code) -
Server Error(URL returning the5xxstatus code) -
Unreachable(URL where we didn’t receive any response for the monitoring request)
Segments
The Segments column allows you to filter on specific segments that have been defined on your website. You can read more about Segments in this support article.
Importance
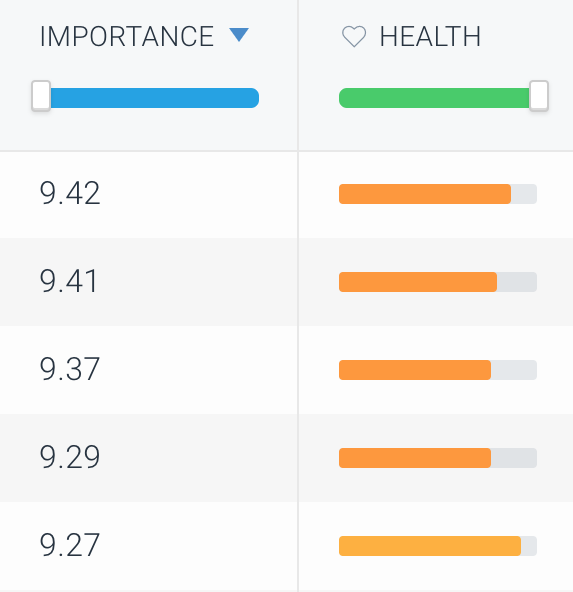
The Importance column shows the Importance score of the individual pages. The score only applies to Pages and is not calculated for other URL Types.
The filter in this column has the form of a slider which you can use to set the score threshold according to your needs. You can read more about the Importance score in this support article.
Health
The Health column shows the Health score of the individual pages. The score only applies to Pages and is not calculated for other URL Types.
The filter in this column has the form of a slider which you can use to set the score threshold according to your needs. You can read more about the Health score in this support article.
URL Depth
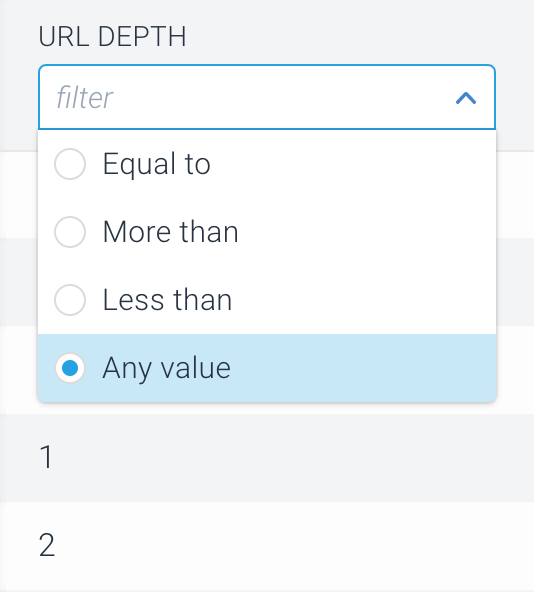
The URL Depth column shows how deep a URL is within the website’s URL structure. The filter value of this column is a number.
HTTPS
The HTTPS column shows whether a URL is available via HTTPS. The filter values of this column are Yes and No.
Full URL
The Full URL column shows the full (absolute) URL path of the individual URLs, including the domain. The filter in this column has the form of a text input field.
Domain
The Domain column shows the domain variant on which a URL is. The filter in this column has the form of a text input field.
Status
The Status column shows the status code that a URL is returning. The filter value of this column is a number (status code).
Redirect target
The Redirect target column shows the redirect target for redirected URLs. The redirect targets are displayed as absolute URLs. The filter in this column has the form of a text input field.
Download Time
The Download Time column shows how many milliseconds ContentKing needed to download the page. The calculation for Download Time is TTFB + time required for downloading the document. The filter value of this column is a number.
Discovered
The Discovered shows the date when a URL was discovered by ContentKing. The date in this column is displayed in the MM/DD/YYYY format. The filter value of this column is a number.
Indexability
Indexable
The Indexable column shows whether a URL is indexable for search engines. The filter values of this column are Yes and No.
Robots.txt
The Robots.txt column shows whether a URL is prevented from indexing due to the directives in the robots.txt file. The filter values of this column are Allowed and Disallowed.
Meta robots
The Meta robots column shows whether a URL is prevented from indexing due to meta robots directives. The filter values of this column are Indexable, Non-indexable, and not applicable.
X-Robots-Tag
The X-Robots-Tag column shows whether a URL is prevented from indexing due to the X-Robots-Tag HTTP header. The filter values of this column are Indexable, Non-indexable, and not applicable.
Canonical URL
The Canonical URL column shows the canonical link target for canonicalized URLs.
In case there are two canonical URLs on a page – one in the HTML source code and one in the HTTP header – the column will show the canonical URL from the HTTP header which is considered primary.
Canonical Type
The Canonical Type column shows the type of the canonical link that a URL has. The column has the following filter values: Internal Self Other page Cross-domain Invalid Missing Not applicable
In XML sitemap
The In XML sitemap column shows whether a URL is present in the XML sitemap or not. The filter values of this column are Yes and No.
Relations
Linked
The Linked column shows whether a URL has any incoming internal links. If a URL has at least 1 incoming link from another page on the website, it is considered Linked. The filter values of this column are Yes and No.
Hreflang
The Hreflang column shows the language version of a URL as defined using the hreflang attribute. The value displayed in the column is the language (and region) code of the hreflang variant (e.g. en-us). The filter in this column has the form of a text input field.
Hreflang variants
The Hreflang variants column shows how many language variants a URL has as defined using the hreflang attribute. The filter value of this column is a number.
Prev
The Prev column shows the URL that is linked from a page using the rel=”prev” pagination attribute. The values in this column are displayed as absolute URLs.
Next
The Next column shows the URL that is linked from a page using the rel=”next” pagination attribute. The values in this column are displayed as absolute URLs.
Incoming internal links
The Incoming internal links column shows how many incoming internal links a URL has. The filter value of this column is a number.
Outgoing internal links
The Outgoing internal links column shows how many outgoing internal links a URL has. The filter value of this column is a number.
Outgoing external links
The Outgoing external links column shows how many outgoing external links a URL has. The filter value of this column is a number.
Incoming canonical links
The Incoming canonical links column shows how many incoming canonical links a URL has. The filter value of this column is a number.
Incoming redirects
The Incoming redirects column shows how many incoming redirects a URL has. The filter value of this column is a number.
Mobile variant
The Mobile variant column shows the mobile variant of the page as defined using the rel=”alternate” attribute. The filter in this column has the form of a text input field.
AMP variant
The AMP variant column shows the AMP variant of the page as defined using the rel="amphtml" attribute. The filter in this column has the form of a text input field.
Content
Title
The Title column shows the page title of the page. The filter in this column has the form of a text input field.
Meta Description
The Meta Description column shows the meta description of the page. The filter in this column has the form of a text input field.
H1
The H1 column shows the H1 heading of the page. The filter in this column has the form of a text input field.
Custom Elements
The Custom Elements category includes columns for custom elements that you have configured in ContentKing. You can read more about our Custom Element Extraction feature here.
Enrichment Fields
The Enrichment Fields category includes columns for enrichment fields that you have configured through the Data Enrichment API. You can read more about our Data Enrichment API feature here.
Google Search Console
The columns in this category represent different Google Search Console metrics and are available if you have the Google Search Console integration active. The data shown in these columns is always aggregated for the past 90 days.
Clicks
The Clicks column shows the value of the Clicks metric from Google Search Console, if you have this integration active.The filter value of this column is a number.
CTR
The CTR column shows the value of the CTR metric from Google Search Console, if you have this integration active. The filter value of this column is a number (percentage).
Impressions
The Impressions column shows the value of the Impressions metric from Google Search Console, if you have this integration active. The filter value of this column is a number.
Position
The Position column shows the value of the Position metric from Google Search Console, if you have this integration active. The filter value of this column is a number.
Google Analytics
The columns in this category represent different Google Analytics metrics and are available if you have the Google Analytics integration active. The data shown in these columns is always aggregated for the past 90 days.
Depending on whether you've connected Google Universal Analytics or Google Analytics 4 you will see appropriate metrics in the columns.
Google Universal Analytics
Pageviews
The Pageviews column shows the value of the Pageviews metric from Google Analytics, if you have this integration active. The filter value of this column is a number.
Unique Pageviews
The Unique Pageviews column shows the value of the Unique Pageviews metric from Google Analytics, if you have this integration active. The filter value of this column is a number.
Avg. Time on Page
The Avg. Time on Page column shows the value of the Average Time on Page metric from Google Analytics, if you have this integration active. The filter value of this column is a number (seconds).
Bounce Rate
The Bounce Rate column shows the value of the Bounce Rate metric from Google Analytics, if you have this integration active. The filter value of this column is a number (percentage).
Page Value
The Page Value column shows the value of the Page Value metric from Google Analytics, if you have this integration active. The filter value of this column is a number (currency).
Google Analytics 4
Screen Pageviews
The Screen Pageviews column shows the value of the screenPageViews metric from Google Analytics, if you have this integration active. The filter value of this column is a number.
Active Users
The Active Users column shows the value of the activeUsers metric from Google Analytics, if you have this integration active. The filter value of this column is a number.
User Engagement
The User Engagement column shows the value of the userEngagementDuration metric from Google Analytics, if you have this integration active. The filter value of this column is a number (seconds).
Engagement Rate
The Engagement Rate column shows the value of the engagementRate metric from Google Analytics, if you have this integration active. The filter value of this column is a number (percentage).
Adobe Analytics
The columns in this category represent different Adobe Analytics metrics and are available if you have the Adobe Analytics integration active. The data shown in these columns is always aggregated for the past 90 days.
Page Views
The Page Views column shows the value of the Page views metric from Adobe Analytics, if you have this integration active. The filter value of this column is a number.
Unique Visitors
The Unique Visitors column shows the value of the Unique Visitors metric from Adobe Analytics, if you have this integration active. The filter value of this column is a number.
Average time spent on site
The Average time spent on site column shows the value of the Average time on site metric from Adobe Analytics, if you have this integration active. The filter value of this column is a number (seconds).
Bounce rate
The Bounce Rate column shows the value of the Bounce Rate metric from Adobe Analytics, if you have this integration active. The filter value of this column is a number (percentage).
Revenue
The Revenue column shows the value of the Revenue metric from Adobe Analytics, if you have this integration active. The filter value of this column is a number (currency).
Conversions
Analytics
The Analytics column shows what kind of analytics tracking is present on the page (if any). Example value: Google Analytics
Visual Analytics
The Visual Analytics column shows what kind of visual analytics tracking is present on the page (if any). Example value: Hotjar
Tag Manager
The Tag Manager column shows what kind of tag manager is present on the page (if any). Example value: Google Tag Manager
Social
Open Graph Type
The Open Graph Type column shows the value of the og:type property on the page. Example values: website, article, object. The filter in this column has the form of a text input field.
Open Graph URL
The Open Graph Type column shows the value of the og:url property on the page (a URL). The filter in this column has the form of a text input field.
Open Graph Title
The Open Graph Title column shows the value of the og:title property on the page (a text/string). The filter in this column has the form of a text input field.
Open Graph Description
The Open Graph Description column shows the value of the og:description property on the page (a text/string). The filter in this column has the form of a text input field.
Open Graph Image
The Open Graph Image column shows the value of the og:image property on the page (a URL). The filter in this column has the form of a text input field.
Twitter Card
The Twitter Card column shows the value of the twitter:card property on the page. Example values: summary, app, player. The filter in this column has the form of a text input field.
Twitter Site
The Twitter Site column shows the value of the twitter:site property on the page. The filter in this column has the form of a text input field.
Twitter Title
The Twitter Title column shows the value of the twitter:title property on the page (a text/string). The filter in this column has the form of a text input field.
Twitter Description
The Twitter Description column shows the value of the twitter:description property on the page (a text/string). The filter in this column has the form of a text input field.
Twitter Image
The Twitter Image column shows the value of the twitter:image property on the page (a URL). The filter in this column has the form of a text input field.
Schema.org
Schema.org items
The Schema.org items column shows how many Schema.org items are present on the page. The filter value of this column is a number.
Schema.org types
The Schema.org types column shows which types of the Schema.org items are present on the page. In case of multiple Schema.org types being present on a page, they are separated by a comma and space. Example values: Organization, FAQPage, Article, Person
Lighthouse Web Vitals
The columns in this category represent the scores for the Lighthouse Web Vitals metrics and are available if you enable the Lighthouse Monitoring feature. You can read more about the feature in this support article.
Performance
The Performance column displays the overall Lighthouse performance score. It is a weighted average of other Lighthouse metric scores and it's a value on a scale from 4 (very bad) to 100 (amazing). The filter value of this column is a number.
Largest Contentful Paint (LCP)
The Largest Contentful Paint (LCP) is a Core Web Vital that measures the time in seconds from when the page starts loading to when the largest text block or image element is rendered on the screen. The lower the Largest Contentful Paint score is, the better. The filter value of this column is a number in seconds.
Cumulative Layout Shift (CLS)
The Cumulative Layout Shift (CLS) is a Core Web Vital that measures the cumulative score of all unexpected layout shifts within the viewport that occur during a page’s entire lifecycle. The lower the Cumulative Layout Shift score is, the better. The filter value of this column is a number.
First Contentful Paint (FCP)
The First Contentful Paint (FCP) is a non-Core Web Vital that measures the time from when a page starts loading to when any part of that page’s content is rendered on the screen. The lower the First Contentful Paint score is, the better. The filter value of this column is a number in seconds.
Time to Interactive (TTI)
The Time to Interactive (TTI) is a non-Core Web Vital that measures the time from when the page starts loading to when it's fully interactive. The lower the Time to Interactive score is, the better. The filter value of this column is a number in seconds.
Speed Index (SI)
The Speed Index (SI) is a non-Core Web Vital that measures how quickly the contents of a page are visibly populated during page load. The lower the Speed Index score is, the better. The filter value of this column is a number in seconds.
Total Blocking Time (TBT)
The Total Blocking Time (TBT) is a non-Core Web Vital that measures the total time in milliseconds between First Contentful Paint (FCP) and Time To Interactive (TTI) where the main thread is blocked long enough to make it unresponsive to the user input. The lower the Total Blocking Time score is, the better. The filter value of this column is a number in milliseconds.
Search Engine Activity
The columns in this category represent the search engine visits data and are available if you enable the Log File Analysis feature. You can read more about the feature in this support article.
Google Visit frequency
The Google Visit frequency column shows how often Google Desktop and Google Mobile bots visited the page per month. The filter value of this column is a number (per month).
Google Last visited
The Google Last visited column shows how long ago did the Google Desktop or Google Mobile bots visited the page. The filter value of this column is a number (days ago).
Google Desktop Visit frequency
The Google Desktop Visit frequency column shows how often the Google Desktop bot visited the page per month. The filter value of this column is a number (per month).
Google Desktop Last visited
The Google Desktop Last visited column shows how long ago did the Google Desktop bot visited the page. The filter value of this column is a number (days ago).
Google Mobile Visit frequency
The Google Mobile Visit frequency column shows how often the Google Mobile bot visited the page per month. The filter value of this column is a number (per month).
Google Mobile Last visited
The Google Mobile Last visited column shows how long ago did the Google Mobile bot visited the page. The filter value of this column is a number (days ago).
Bing Visit frequency
The Bing Visit frequency column shows how often Bing Desktop and Bing Mobile bots visited the page per month. The filter value of this column is a number (per month).
Bing Last visited
The Bing Last visited column shows how long ago did the Bing Desktop or Bing Mobile bots visited the page. The filter value of this column is a number (days ago).
Bing Desktop Visit frequency
The Bing Desktop Visit frequency column shows how often the Bing Desktop bot visited the page per month. The filter value of this column is a number (per month).
Bing Desktop Last visited
The Bing Desktop Last visited column shows how long ago did the Bing Desktop bot visited the page. The filter value of this column is a number (days ago).
Bing Visit frequency
The Bing Visit frequency column shows how often Bing Desktop and Bing Mobile bots visited the page per month. The filter value of this column is a number (per month).
Bing Last visited
The Bing Last visited column shows how long ago did the Bing Desktop or Bing Mobile bots visited the page. The filter value of this column is a number (days ago).
Bing Mobile Visit frequency
The Bing Mobile Last visited column shows how long ago did the Bing Mobile bot visited the page. The filter value of this column is a number (days ago).
Bing Mobile Last visited
The Bing Mobile Last visited column shows how long ago did the Bing Mobile bot visited the page. The filter value of this column is a number (days ago).

